AI Stock Analysis. Financials, fair value, risks.
Peakwise is an AI stock analysis tool and stock analyzer. Search a company and get a research report: price chart, financials, news, analyst consensus and a fair value range, with the case for and against. A starting point for your research, not a verdict.
- Fair value as a range
- News and analyst views
- Not investment advice
AAPL Apple Inc.
$214.60
Sample data
18 Feb
Close $198.78
MA20 $197.46
MA50 $191.58
Sample data
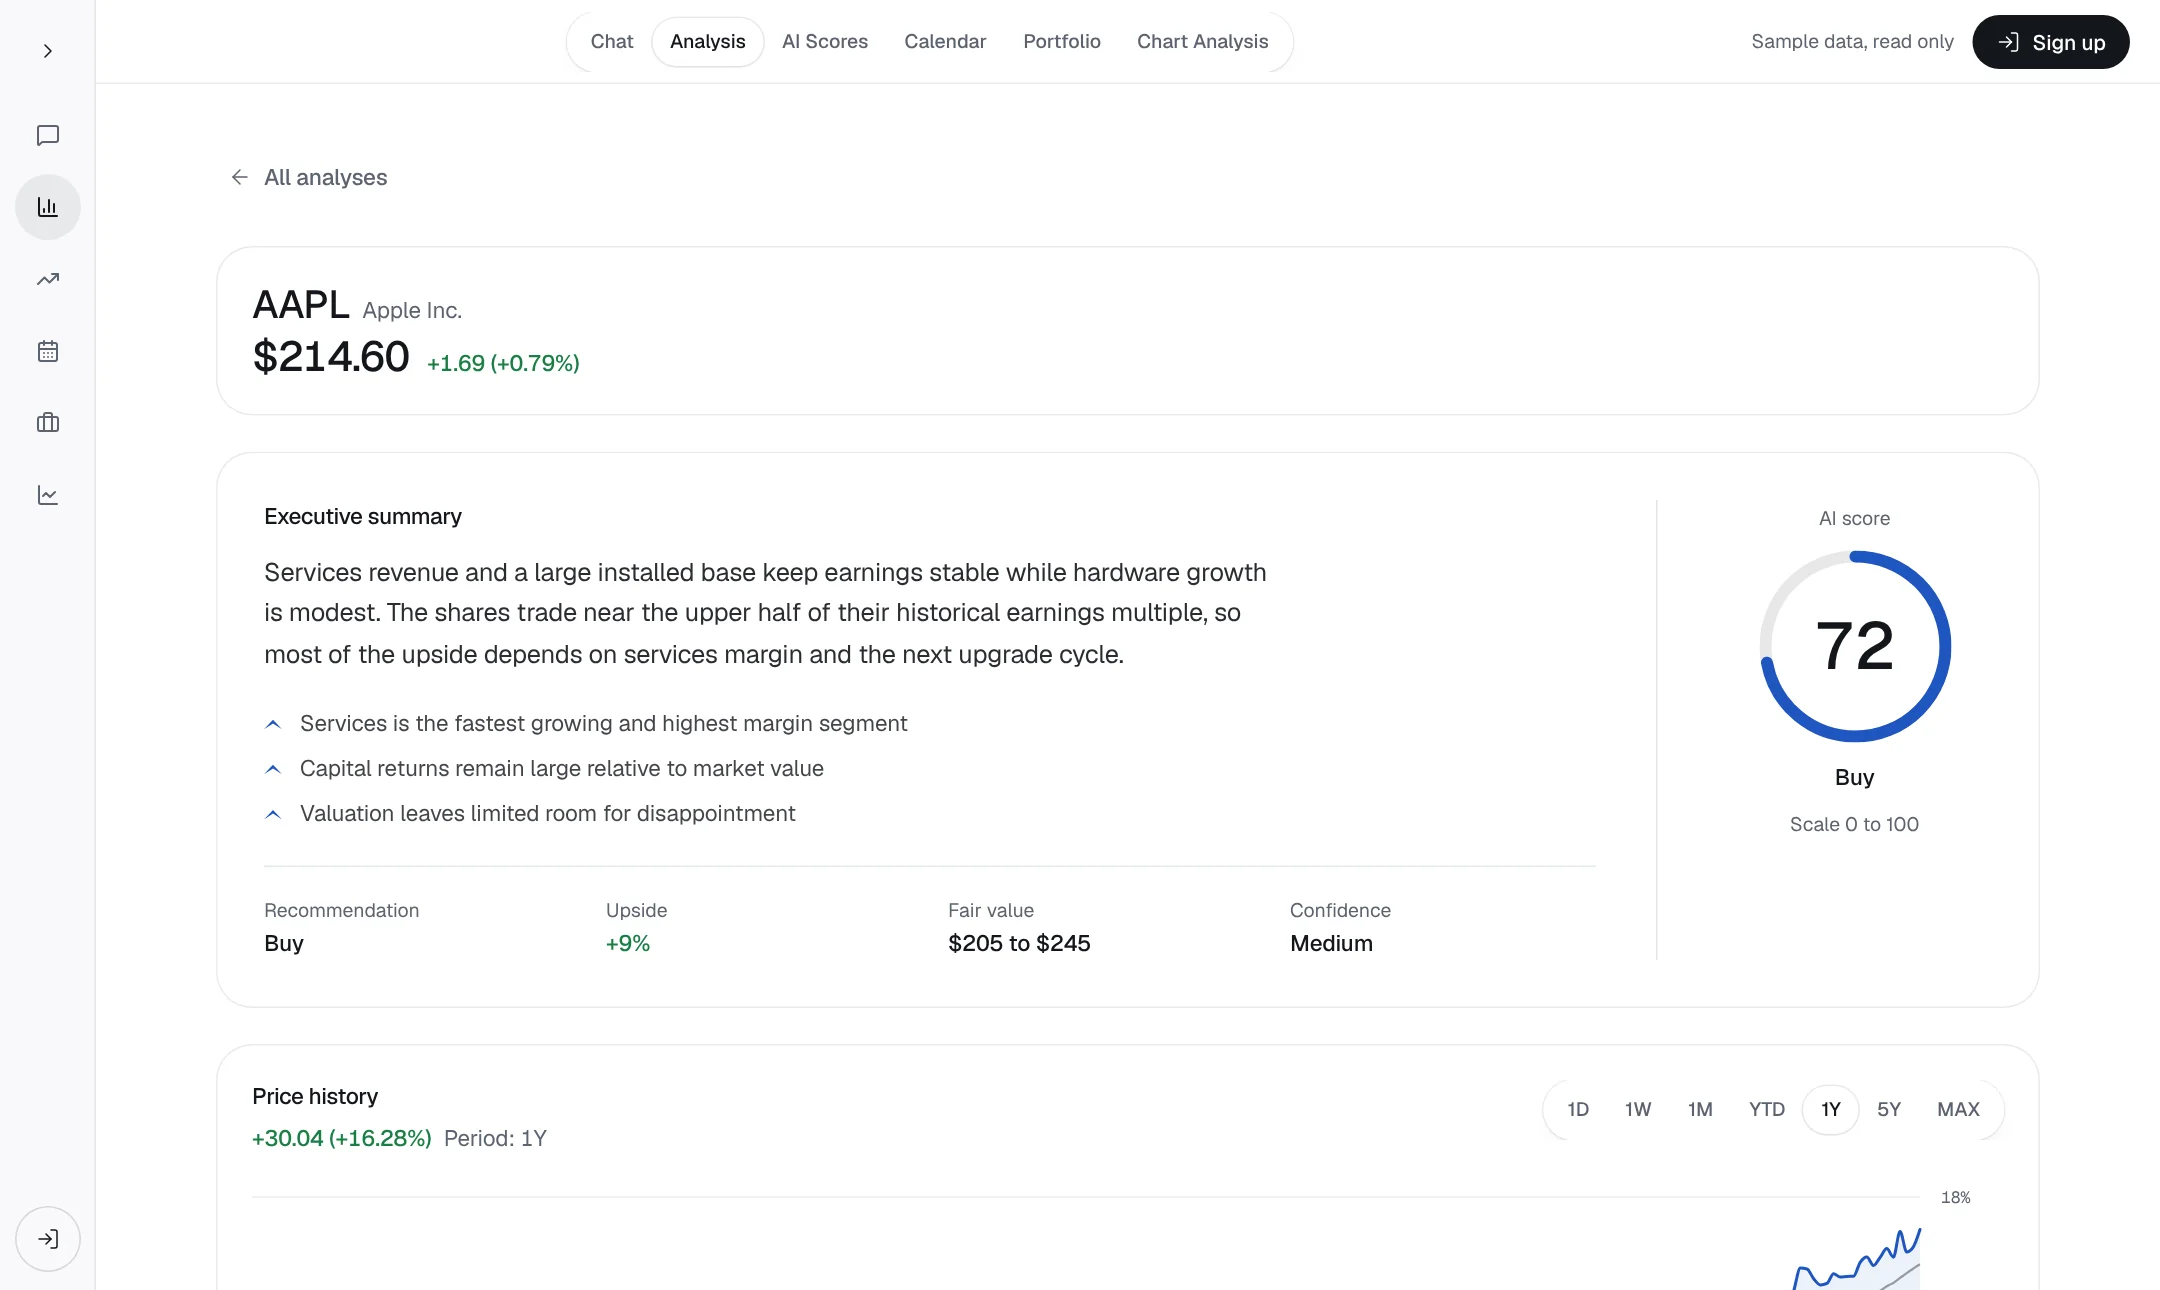
What It Contains. Numbers and reasoning together.
Price chart and quote
The current quote and a price chart over several periods.
Financials
Revenue, net income, margins, free cash flow and debt to equity, each with a comment.
Fair value range
A low, mid and high estimate with the method used and a verdict.
Analyst consensus
The overall rating, the buy, hold and sell split and the price targets.
News and sentiment
Recent headlines labeled positive, neutral or negative, with a summary.
Macro, risks and opportunities
Macro factors for the company, plus a list of risks and opportunities.
Upcoming events
Earnings dates and other events ahead, marked by importance.
Ask follow-ups
Open the chat next to the analysis and ask about the bear case or a number.
Fair Value Range. Not one target number.
A low, mid and high estimate with the method used, and a verdict of undervalued, fairly valued or overvalued.
- Low, mid and high estimate
- The method is stated
- Confidence: low, medium or high
Verdict
Sample data
Hold
Confidence
- Fair value range
- $118 to $146
- Horizon
- 12 months
Fair value range
Fair valueThe range is an estimate from the analysis. It is no price target.
The Numbers. Financials, analysts, news.
Revenue, margins, free cash flow and debt, each with a short comment. Analyst consensus and headlines sit in the same report.
Financials
Sample data
- RevenueUp 9% year on year$96.8B
- Operating marginStable over three years31%
- Free cash flowCovers the dividend 4 times$24.1B
- Debt to equityLow for the sector0.4
Analyst consensus
Sample data
- Buy58%
- Hold34%
- Sell8%
AI Stock Screener. What it checks.
A screener narrows a large list to a short one by valuation, financial health or sentiment. An analysis then looks at one company in depth. Peakwise has both: the AI stock finder scores 50 large S&P 500 stocks on six parts, the analysis covers any listed company. The score methodology lists every input.
- Momentum and trend, 50%: price change over 3, 6 and 12 months, price against the 200 day average
- Volatility and drawdown, 30%: how calm the price was, how deep the largest fall
- Quality and valuation, 20%: margin, debt, earnings yield, free cash flow yield
Analysis, Screener, Chatbot. Which to use when.
| Compare | Stock analysis | Stock screener | Stock chatbot |
|---|---|---|---|
| Best for | One company in depth | Many stocks to a short list | Open questions, quick answers |
| What you get | A report, same sections for every stock | A ranked or filtered list of tickers | A written answer to your question |
| In Peakwise | AI stock analysis, this page | AI stock finder | Peakwise Chat |
Best Stock Analysis App. What to look for.
The best stock analysis app fits how you research, so judge a tool on a few points, not a ranking. Peakwise is a research tool: it does not place trades or give personal investment advice.
- Current data: does it say where figures come from?
- Visible reasoning: does it explain a score, or only show a number?
- Both sides: are risks shown next to the upside?
- No pressure to trade: does it leave the decision to you?
- A clear price: are cost and trial stated up front?
Both Sides. Risks next to opportunities.
Risks and opportunities sit on the same page as the verdict. A starting point for your research.
Fair value range
Fair valueThe range is an estimate from the analysis. It is no price target.
Analyst consensus
Sample data
- Buy58%
- Hold34%
- Sell8%
Risks and opportunities
Sample data
- Shares trade above their five year average multiple
- Hardware growth is modest
- Expectations for AI revenue are high
- Services revenue keeps growing
- Large installed base keeps earnings stable
- Capital returns remain large
Price chart and quote
The analysis sits next to the price.
Macro, risks and opportunities
The factors that matter, as a list.
Not investment advice
A report to check, not a verdict.
Analyze a Stock with AI. Three steps.
- 01
Search a company
Enter a name or ticker, or open a stock from the AI stock finder.
- 02
Generate the analysis
Peakwise builds the report from market data and a web search.
- 03
Read, question, save
Check the figures, ask follow-ups, save the analysis.